Use Devon’s “rubbish” data as part of maths and ICT lessons!
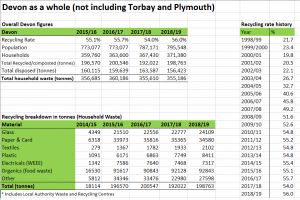
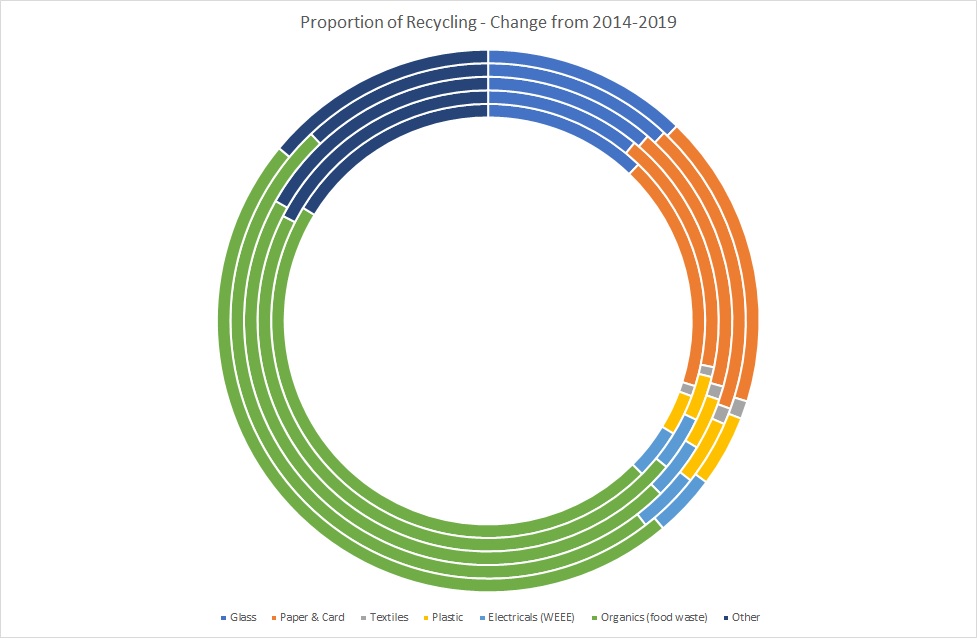
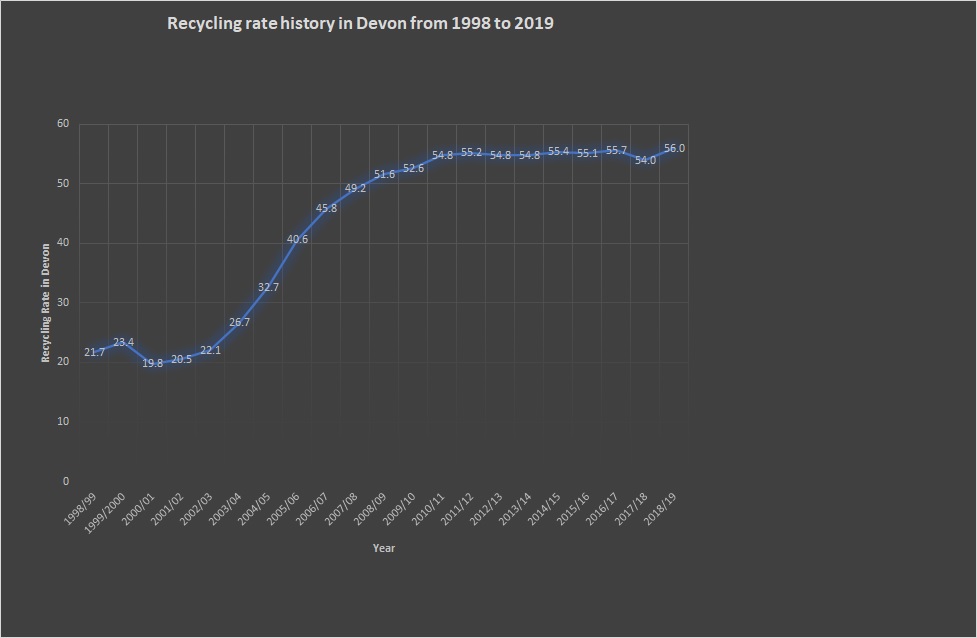
The downloadable spreadsheet below includes data from each Devon district (East Devon, Exeter, Mid Devon, North Devon, South Hams, Teignbridge, Torridge, West Devon and the Unitary Authorities of Plymouth and Torbay) showing what materials are currently recycled, and how the local recycling rate has changed in the last ten years. The data can be used by pupils in a variety of ways, such as creating pie and line charts.
NOTE the different districts are on separate tabs at the bottom of the spreadsheet.
Consider combining a maths and ICT lesson and encourage pupils to work in pairs on the spreadsheet!
Some ideas to try:
- Make a graph showing the changes in recycling rate
- Plot a bar chart of the materials recycled in Devon
- Calculating the % change in districts recycling rate and materials recycled
- Is there a positive or negative correlation between population count and waste produced?
National Curriculum Links
Y3 Maths: Interpret and present data using bar charts, pictograms and tables
- Solve one-step and two-step questions, such as ‘How many more?’ and ‘How many fewer?’ using information presented in scaled bar charts and pictograms and tables
Y4 Maths: Interpret and present discrete and continuous data using appropriate graphical methods, including bar charts and time graphs.
Y5 Maths: Complete, read and interpret information in tables, including time-tables.
Y6 Maths: Interpret and construct pie charts and line graphs, and use these to solve problems.
KS2 Computing: Select, use and combine a variety of software.
KS3 Computing: Undertake creative projects that involve selecting, using and combining multiple applications, to achieve challenging goals, including collecting and analysing data.


